
Finished Vehicle Logistics KPIs for Dealer Groups (2026)
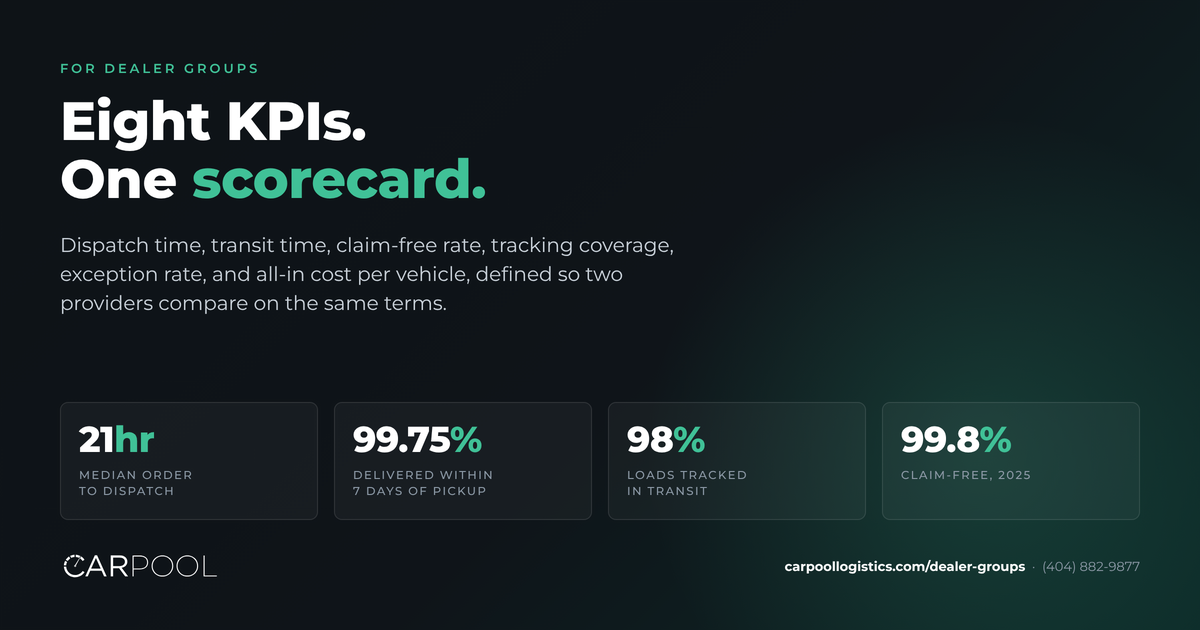
Finished vehicle logistics KPIs are the handful of measurements that tell a dealer group whether its transport partner is actually performing: how fast vehicles move, how often they arrive damaged, how visible they are in transit, and what each move really costs once lot days and staff time are counted. Most dealer groups track none of these. They know their average carrier rate and they remember the last bad delivery, and that is the extent of the scorecard.
This guide defines the eight KPIs that matter for dealer group logistics, gives each one a formula and a denominator so two providers can be compared on the same terms, and explains how to get the numbers from a partner who may not volunteer them. It is a companion to Choosing a Finished Vehicle Logistics Partner, which covers the selection process; this one covers what to measure once you are running.
Key takeaways
- A KPI is only useful if it has a written definition, a denominator, and a time window. "On-time delivery" means nothing until you say on time against what, measured over how many vehicles.
- The eight KPIs that matter for dealer groups: order-to-dispatch time, pickup-to-delivery transit time, ETA adherence, claim-free rate, tracking coverage, exception rate, carrier compliance rate, and all-in cost per vehicle.
- Ask providers for figures with their definitions and sample sizes. A provider that publishes a 99.8% claim-free rate should be able to tell you the year and the number of vehicles behind it; Carpool Logistics' figure is calendar 2025.
- Cost per vehicle must include what the carrier invoice leaves out: lot days waiting for dispatch, staff hours spent chasing status, and the retail margin lost to transport damage.
- Review KPIs monthly by rooftop and lane. The pattern across 90 days tells you more than any single move.
What is a finished vehicle logistics KPI?
Finished vehicle logistics (FVL) is the movement of complete, drivable vehicles from where they are to where they will be sold or used: plant to port, port to dealer, auction to rooftop, rooftop to customer. The European industry body Odette, with the ECG association of vehicle logistics providers, maintains a standard KPI framework for FVL covering damage, transit time, and delivery performance that OEMs and their carriers report against. Dealer groups rarely see it, because it was written for the OEM-to-dealer leg.
The dealer-group version of the problem is smaller and messier: dozens of lanes, several inventory sources, a mix of carriers, and transport decisions made by whoever bought the car. The KPIs below adapt the same logic (measure speed, damage, visibility, and cost with consistent definitions) to that reality. They work whether you self-manage on a load board, use several brokers, or run everything through one managed provider.
The 8 finished vehicle logistics KPIs dealer groups should track
1. Order-to-dispatch time
Definition: Hours from order placement to a carrier being assigned to the vehicle.
Formula: Report the median, not the mean; a few stuck orders will drag an average and hide what the typical vehicle experiences. Denominator: all dispatched orders in the period.
Why it matters: Dispatch is where load-board self-management loses the most time. A vehicle posted at a low rate can sit for days before a carrier accepts it, and every one of those days is a lot day plus a day of depreciation. Carpool Logistics' median order-to-dispatch was 21 hours in calendar 2025.
What to ask a provider: "What was your median order-to-dispatch last quarter, and what percentage of orders were dispatched within 48 hours?"
2. Pickup-to-delivery transit time
Definition: Days from the vehicle leaving origin to arrival at destination.
Formula: Report as a distribution: median days, and the percentage delivered within a threshold appropriate to your lanes (seven days is the common benchmark for mixed regional and long-haul volume). Denominator: all delivered vehicles.
Why it matters: Transit time is where mileage, carrier routing, and multi-stop loads show up. It is distinct from dispatch time; a provider can dispatch fast and still deliver slowly if its carriers run long multi-drop routes. Carpool delivers 99.75% of vehicles within seven days of pickup.
What to ask: "What percentage of your deliveries complete within seven days of pickup, and how does that break out for lanes over 500 miles?"
3. ETA adherence
Definition: Percentage of vehicles delivered on or before the delivery date the provider committed to.
Formula: Count a delivery as on time if it arrives on or before the latest ETA communicated to you. Be explicit about whether you measure against the first ETA quoted or the latest one; providers that revise ETAs freely will look better against the latest. Denominator: delivered vehicles with a communicated ETA.
Why it matters: ETA adherence is what your sales floor and your customers experience. It also exposes a provider's honesty: a tight adherence number against a date-level ETA is more useful than a loose number against a vague window.
What to ask: "Do you measure against first ETA or latest ETA, are your ETAs dates or time windows, and how often does the ETA change after dispatch?"
4. Claim-free rate (damage rate)
Definition: Percentage of delivered vehicles with no damage claim filed.
Formula: (Vehicles delivered minus vehicles with a claim) divided by vehicles delivered, over a stated period. The inverse, claims per 1,000 vehicles, is the form the OEM frameworks use and is easier to compare across providers of different size. Denominator: all delivered vehicles in the period, not just those inspected.
Why it matters: Transport damage costs far more than the repair. A $400 scratch on a frontline unit means days off the line, a reconditioning ticket, and sometimes a lost sale. Carpool's claim-free rate was 99.8% for calendar 2025, which is two claims per thousand vehicles.
What to ask: "What is your claim-free rate, over what period and how many vehicles, and what counts as a claim: anything reported, or only claims paid?"
5. Tracking coverage
Definition: Percentage of loads with live in-transit location data, not just pickup and delivery scans.
Formula: Loads with at least one GPS or app location event between pickup and delivery, divided by all loads. Denominator: all loads in the period.
Why it matters: Visibility is binary per load: either you can see the vehicle moving or you are calling a dispatcher. A provider's tracking coverage tells you how much of your inventory in transit is actually observable. Carpool reports in-transit tracking points on 98% of loads; every move also carries a live tracking link and geo-tagged inspection photos at both ends.
What to ask: "What percentage of your loads have in-transit GPS points, and is tracking available to us by link, in a portal, and by API?"
6. Exception rate
Definition: Percentage of moves requiring intervention outside the normal flow: carrier no-show, missed pickup window, re-dispatch, damage report, delivery refused, or documentation dispute.
Formula: Moves with at least one logged exception divided by all moves. Track the exception types separately; a high re-dispatch rate and a high damage rate are different problems. Denominator: all moves in the period.
Why it matters: Exceptions are where your staff time goes. A provider with a low headline rate but a 15% exception rate is consuming your people even when nothing is technically wrong. This is the KPI most providers cannot produce, which is itself informative.
What to ask: "What percentage of our moves last quarter had a re-dispatch, a missed pickup window, or a damage report, and who resolved each?"
7. Carrier compliance rate
Definition: Percentage of moves assigned to a carrier whose authority, insurance, and safety record were verified at the time of assignment.
Formula: Moves where the assigned carrier passed a documented verification check at or after assignment, divided by all moves. Denominator: all moves. If a provider only verifies at onboarding, the honest answer to this KPI is "unknown for moves after the first."
Why it matters: Insurance lapses, authority revocations, and identity fraud happen between onboarding and the load. Re-verification at each assignment is the control. Carpool vets carriers through MyCarrierPortal at onboarding and re-verifies at every load assignment; Carpass, its patent-pending driver verification, is the latest layer on that work, confirming the driver on site matches the identity on file.
What to ask: "Do you re-verify carrier authority and insurance at every assignment, or only at onboarding, and how do you confirm the driver who arrives is the one assigned?"
8. All-in cost per vehicle
Definition: Total cost of moving a vehicle, including the carrier invoice and the costs the invoice leaves out.
Formula: Carrier rate + (lot days awaiting dispatch × daily holding cost) + (staff hours on the move × loaded hourly rate) + (damage repair and lost margin ÷ vehicles moved). Denominator: all vehicles moved in the period.
Why it matters: This is the KPI that reconciles the others. A provider with a lower rate card and slower dispatch, thinner tracking, and more exceptions is frequently the more expensive option once the hidden costs are counted. Build it once with real numbers from your own stores and the comparison usually settles itself.
What to ask: "Can you give us dispatch time, exception counts, and claim history for our volume so we can compute all-in cost ourselves?"
FVL KPI reference table
| KPI | Formula | Denominator | Report as | Carpool Logistics (where published) |
|---|---|---|---|---|
| Order-to-dispatch | Hours, order placed to carrier assigned | Dispatched orders | Median hours | 21-hour median (CY2025) |
| Transit time | Days, pickup to delivery | Delivered vehicles | Median days; % within 7 days | 99.75% within 7 days of pickup |
| ETA adherence | Delivered on or before committed date | Deliveries with an ETA | %; state first vs. latest ETA | ETA on every move; account-level reporting |
| Claim-free rate | (Delivered − claims) ÷ delivered | Delivered vehicles | %; or claims per 1,000 | 99.8% (CY2025) |
| Tracking coverage | Loads with in-transit location events ÷ loads | All loads | % | 98% of loads |
| Exception rate | Moves with a logged exception ÷ moves | All moves | % by exception type | Account-level reporting |
| Carrier compliance | Moves with carrier verified at assignment ÷ moves | All moves | % | Re-verified at every assignment |
| All-in cost per vehicle | Rate + holding + staff time + damage cost | Vehicles moved | $ per vehicle | Computed from your data |
How to get KPIs from a logistics partner who does not publish them
Most providers will give you a rate and a reference. Getting the numbers above takes three steps.
Write the definitions into the agreement. Put the eight KPIs, with formulas and denominators, into the RFP or the service agreement, and require quarterly reporting against them. A provider that balks at defining "on time" is telling you something.
Insist on your own data, not network averages. A provider's network-wide claim-free rate is a starting point; your lanes, your rooftops, and your vehicle mix are what you will live with. Ask for account-level reporting by rooftop and lane.
Get the raw events. The strongest position is one where you can compute the KPIs yourself from order, dispatch, pickup, delivery, and exception timestamps. Providers with a real platform can export these or expose them by API; Carpool's customer portal and API expose order and vehicle events, including outbound webhooks, for exactly this purpose.
How to run a monthly FVL review
Pull the eight KPIs by rooftop and by lane. Look for three things: any KPI that moved more than a few points month over month, any rooftop that is consistently worse than the group on the same KPI (usually a process problem at the store, not a provider problem), and any lane where transit time and exception rate are both high (usually a capacity problem the provider should be routing around). Bring the exceptions list to the review, not just the percentages; the five worst moves of the month teach more than the averages.
After two or three cycles, you will have a baseline. That baseline, not a sales deck, is what you compare the next provider against.
How Carpool Logistics reports against these KPIs
Carpool Logistics is a managed vehicle transport platform that moves 210,000+ vehicles a year for dealer groups, dealers, auctions, and fleets, and it was built to make these measurements visible rather than requested. Every order, dispatch, pickup, in-transit location, and delivery is a timestamped event on the VIN, available in the customer portal and by API. Dealer group accounts get consolidated reporting across every rooftop and inventory source, a dedicated account team, and the published network figures above as the starting benchmark for their own account-level numbers.
See the dealer group program or talk to the sales team at (404) 882-9877 about setting up KPI reporting for your group.
FAQs about finished vehicle logistics KPIs
What are the most important KPIs in finished vehicle logistics?
For a dealer group: order-to-dispatch time, transit time, ETA adherence, claim-free rate, tracking coverage, exception rate, carrier compliance, and all-in cost per vehicle. OEM frameworks such as Odette's add plant-side and port-side measures that do not apply to dealer moves.
What is a good claim-free rate for vehicle transport?
Ask for the definition before judging the number. A rate above 99.5% over a full year and tens of thousands of vehicles, counting any filed claim, is strong. Carpool Logistics' published rate is 99.8% for calendar 2025. A higher figure measured over a small sample or counting only paid claims is not comparable.
How should a dealer group measure on-time delivery?
As the percentage of vehicles delivered on or before the committed delivery date, stating whether the comparison is to the first ETA quoted or the latest ETA communicated, and whether the ETA is a date or a time window. Date-level ETAs with adherence measured against the latest communicated date is the most common defensible approach.
What is the difference between dispatch time and transit time?
Dispatch time is how long an order waits before a carrier is assigned; transit time is how long the vehicle is on the truck. A provider can be fast at one and slow at the other, so track both. Together they make up total order-to-delivery time.
How do you calculate the true cost of vehicle transport?
Add the carrier rate to the holding cost of lot days spent waiting for dispatch, the loaded cost of staff hours spent managing the move, and the repair and lost-margin cost of transport damage spread across all vehicles moved. The result, cost per vehicle, is the only number on which two providers with different rate cards can be fairly compared.
Can a dealer group get these KPIs from a load board?
Only by building them. A load board records postings and acceptances; it does not track in-transit location, exceptions, or claims in a way you can report on. Groups that self-manage usually reconstruct these KPIs from spreadsheets and carrier emails, which is a reason many move to a managed provider with a platform.
Want your group's logistics measured the same way every month? Talk to the Carpool sales team or call (404) 882-9877.